Relevant indicators
Metrics connected to specific decisions, owners and objectives.
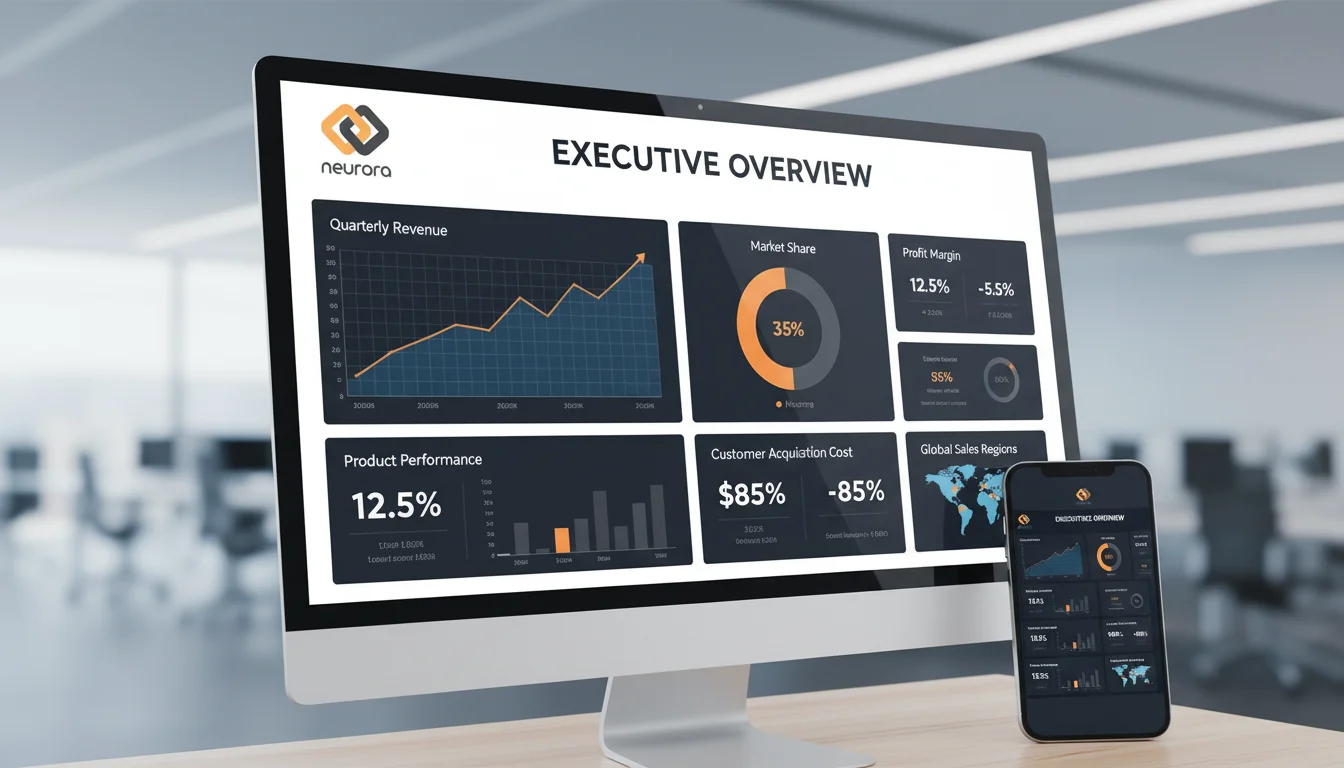
We create executive dashboards with AI that unify business data, detect change, summarise trends and make information easier to interpret.
In many SMEs the information is distributed between different tools, spreadsheets or systems. This makes it difficult to have a clear vision of what is happening in the company and forces you to invest time in collecting data from different sources.
Furthermore, when data is not centralized, it is common for there to be different versions of the same information or for it to not be updated. This generates doubts, errors in decision making and dependence on specific people who know “where everything is.”
Executive dashboards bring together the most important information and present it in a visual and easy-to-understand way. Instead of sifting through multiple files or tools, you have everything relevant in one place.
These dashboards update automatically, displaying reliable data in real time or as frequently as you need. This way you avoid having to prepare reports manually and reduce the risk of working with outdated information.
On a day-to-day basis, this translates into more clarity and less uncertainty. You can review the status of the business in a few minutes, without depending on third parties or spending time collecting data.
This way you can quickly see how the business is evolving and detect problems or opportunities earlier. From deviations in sales to bottlenecks in operations, everything becomes visible immediately.
In addition, it makes it easier for the entire team to work with the same data and with the same vision. This improves internal coordination and avoids misunderstandings or decisions based on incomplete information.
Over time, having this continuous visibility allows for faster and more confident decisions. You go from reacting late to anticipating, with a clear base of information on which to act.


Data for decisions
We design executive dashboards for SMEs that need to understand sales, finance or operations without manually consolidating spreadsheets. We first agree which decisions the dashboard must support, then connect and validate the sources.
Metrics connected to specific decisions, owners and objectives.
Sources combined under consistent rules to avoid contradictory figures.
Executive and operational views with useful filters and detail.
AI applied to data
On top of validated data, we add artificial intelligence functions that reduce review time and help teams ask better questions. Each function is limited to the defined context and permissions.
Explain indicator movements and highlight the most relevant changes in a period.
Flags deviations or unusual behaviour for a person to investigate.
Let users ask questions about data without manually building every filter.
Judgement remains human. AI provides context and signals; it does not repair poor data or make business decisions by itself.
Frequently asked questions
ERP, CRM, spreadsheets, databases and other applications where suitable access is available.
Not by itself. We review quality and rules so the dashboard presents reliable figures.
It can summarise changes, flag anomalies and simplify queries over connected, validated data.
Yes. Management and operational teams can have different indicators, AI functions and detail according to their permissions.